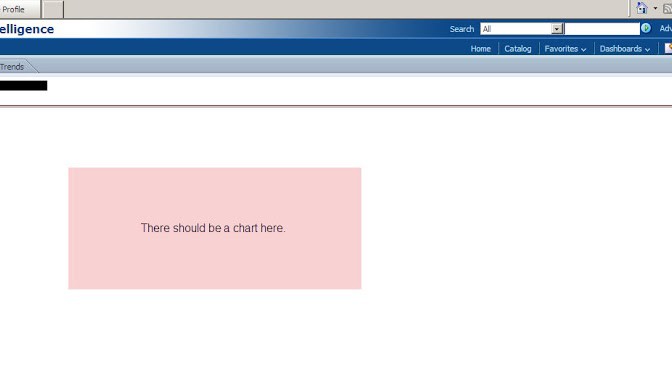
OBIEEEEgads!!! While testing the latest OBIEE 11g implementation, we noticed that certain dashboards were not showing the charts and graphs. Period. Ever see this when you are trying to view a dashboard in Internet Explorer? I added that box in the middle.

A Google search revealed that this is actually an issue with IE and OBIEE. Go figure, some type of compatibility issue with IE. What you really want to see is this screen as Firefox/Aurora has been so kind to show us. Certain information has been hidden to protect the innocent and the guilty.

It actually quite a simple fix. The time it takes will depend on how many Analyses you need to modify. You will need to repeat this process for each Fact.
1. Go to the Criteria Tab of the Analysis used to create the dashboard chart or graph.

2. Click the Data Format tab and make sure that the Use 1000’s Separator box is checked, and click OK.

3. Save your Analysis and check your dashboard in Internet Explorer. You should now see the Chart or Graph.

There ya go!
superb….
I was facing the same issue. Your solution even worked for me..
Thanks for posting this.. it saved lot of my time..
Thanks again man. KUDOS
regards
Abhijith
Many Thanks. It works.
Rgds,
Nagendran