I recently came across a coding challenge. Well, let’s say we needed to handle several combinations of filtering data in a #Pandas Dataframe leveraging the #Streamlit selectbox widget. Not a difficult lift per se. The fun was where it started and where it ended up. Let’s get started.
Scenario
I have 4 columns of data that I need to be filtered. Let create a sample dataset with the following pandas dataframe:
dfrm = pd.DataFrame({'ticker': ['','F', 'F', 'GE', 'GE', 'LUV', 'LUV', 'TWTR', 'TWTR'],
'price': [0,25, 12, 15, 14, 19, 23, 25, 29],
'shares': [0,5, 7, 7, 9, 12, 9, 9, 4],
'options': [0,11, 8, 10, 6, 6, 5, 9, 12],
'year': ['','2000', '2010', '2000', '2015', '2006', '2016', '2010', '2021']})
In a perfect scenario, we’d be using Snowpark to querying Snowflake and using that data in our dataframe. Now that we have our sample data set my first approach was to create a series of CONDITIONAL statements to check if the selectbox widget was used. While it worked, this resulted in a great deal of code which followed this approach:
#Check to see if all selectbox widgets had a value
if f1 in ticker and f2 in price and f3 in shares and f4 in options:
    df=dfrm[((dfrm['ticker']==f1) & (dfrm['price']==f2) & (dfrm['shares']==f3) & (dfrm['options']==f4))]
    st.table(df)

#Check to see if only 3 selectbox widgets had a value
elif f1 in ticker and f2 in price and f3 in shares:
df=dfrm[((dfrm['ticker']==f1) & (dfrm['price']==f2) & (dfrm['shares']==f3))]
st.table(df)

elif f1 in ticker and f2 in price and f4 in options:
df=dfrm[((dfrm['ticker']==f1) & (dfrm['price']==f2) & (dfrm['options']==f4))]
st.table(df)

elif f1 in ticker and f3 in price and f4 in options:
df=dfrm[((dfrm['ticker']==f1) & (dfrm['shares']==f3) & (dfrm['options']==f4))]
st.table(df)

if f2 in price and f3 in shares and f4 in options:
df=dfrm[((dfrm['price']==f2) & (dfrm['shares']==f3) & (dfrm['options']==f4))]
st.table(df)

#Check to see if only 2 selectbox widgets had a value
....
To give and example of the various permutations see this chart. Each row resulting in approximately 3 lines of code.
| ticker | price | shares | options |
|---|---|---|---|
| X | X | X | |
| X | X | X | |
| X | X | X | |
| X | X | X | |
| X | X | ||
| X | X | ||
| X | X | ||
| X | X | ||
| X | X | ||
| X | X | ||
| X | X | X | X |
You can see how this would be extremely long and difficult to read and manage. There has a be a better way!
The first question I asked myself was can I modularize this to reuse code as we notice, most of this is COPY & PASTE of the code structure. A telltale sign that we can most likely leverage a function call. Let’s do this …. but how? What are the repeatable parts? How will we reference them?
Thought Process
- What is repeatable?
- I notice that in each permutation of the CONDITIONAL, the filtering is the thing that repeats. I am always filtering by some value in a column. For example ticker==val, shares==val. Why not create a function or functions to do this?
def tickerfilter(df,val):
    return df[(df.ticker == val)]

def pricefilter(df,val):
    return df[(df.price > val)]

def sharesfilter(df, val):
    return df[(df.shares == val)]

def optionsfilter(df, val):
    return df[(df.options == val)]
There we have it. These four functions individually filter by a value from the selectbox widget passed to the appropriate function .
- Now that I have a way to filter the dataframe, how do I determine which of the four functions to call? Some construct that will allow me to capture the something representing the function and the function to call. Something with a format that represent this: {function_name:value}
- How about a Python DICTIONARY to capture which functions should be called?
- Key-Value pair ✔
- Multiple Data types ✔
- Easy to build ✔
- How about a Python DICTIONARY to capture which functions should be called?
#Declare an empty DICTIONARY
filter_dict = {}

#Function to build list by checking for non empty values returned by the selectbox widget
#This creates a key value pair {tickerfilter:value of f1, pricefilter:value of f2 ....}
def build_filters(f1,f2,f3,f4):
    if f1:
        filter_dict["tickerfilter"]=f1# value from select box
    if f2:
        filter_dict["pricefilter"]=f2# value from select box
    if f3:
        filter_dict["sharesfilter"]=f3# value from select box
    if f4:
        filter_dict["optionsfilter"]=f4# value from select box

    return(filter_dict)
With this we are now successful in dynamically generating a dataset that can orchestrate our filtering process.
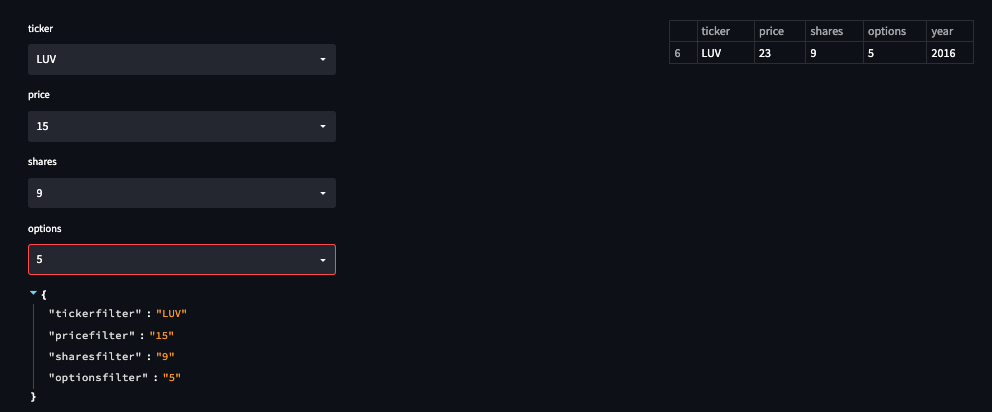
We can now alter the Streamlit selectbox widget display the selection options and populate the
def main():
#Start Streamlit Code

container = st.container()
col1, col2, col3 = container.columns(3)

f1 = col1.selectbox('ticker', dfrm['ticker'].unique())
f2 = col1.selectbox('price', dfrm['price'].unique())
f3 = col1.selectbox('shares', dfrm['shares'].unique())
f4 = col1.selectbox('options', dfrm['options'].unique())

#End Streamlit code
Add some “orchestration”. Notice the this line of code here: rs = (globals()[key](rs,build_dict[key])). I needed a way to tell Python to use the KEY in the DICTIONARY as a function call and not a STRING. This seemed to work and now I can dynamically build a function call using the KEY:VALUE pair in the build_dict DICTIONARY
#Call function to build the list of filters to execute
rs=dfrm
build_dict = build_filters(f1,f2,f3,f4)
#print (build_dict)

#Loop through the list and dynamically build the function call
#statement (globals()[key] will equate to a function name
for key in build_dict:
rs = (globals()[key](rs,build_dict[key]))

#print(rs)
#Display resultset of the filtered dataframe
col3.dataframe(rs)


if __name__=="__main__":
    main()
While this might not be the most optimal way, it was fun to work through a process of looking at this code and rethinking about it a way that is more elegant. We went from about 36 lines of “logic” code in a monolith python program to about 20 lines of modular coding with lots of reusability. Think how these two versions of the code would grow if we added a fifth metric (ie ‘year’).
If you have the open source version of Streamlit installed, here is the full Python program:
import pandas as pd
import streamlit as st

st.set_page_config(
page_title="Python and Streamlit",
layout="wide")

#create a dataframe
dfrm = pd.DataFrame({'ticker': ['','F', 'F', 'GE', 'GE', 'LUV', 'LUV', 'TWTR', 'TWTR'],
'price': [0,25, 12, 15, 14, 19, 23, 25, 29],
'shares': [0,5, 7, 7, 9, 12, 9, 9, 4],
'options': [0,11, 8, 10, 6, 6, 5, 9, 12],
'year': ['','2000', '2010', '2000', '2015', '2006', '2016', '2010', '2021']})


filter_dict = {}


def tickerfilter(df,val):
    return df[(df.ticker == val)]
def pricefilter(df,val):
    return df[(df.price > val)]
def sharesfilter(df, val):
    return df[(df.shares == val)]
def optionsfilter(df, val):
    return df[(df.options == val)]

def build_filters(f1,f2,f3,f4):
    if f1:
        filter_dict["tickerfilter"]=f1# value from select box
    if f2:
        filter_dict["pricefilter"]=f2# value from select box
    if f3:
        filter_dict["sharesfilter"]=f3# value from select box
    if f4:
        filter_dict["optionsfilter"]=f4# value from select box
    return(filter_dict)

def main():

#Start Selectbox Stuff
    container = st.container()
    col1, col2, col3 = container.columns(3)
    f1 = col1.selectbox('ticker',dfrm['ticker'].unique())

    f2 = col1.selectbox('price',dfrm['price'].unique())

    f3 = col1.selectbox('shares',dfrm['shares'].unique())

    f4 = col1.selectbox('options',dfrm['options'].unique())
#End Selectbox Stuff

    rs=dfrm
    build_dict = build_filters(f1,f2,f3,f4)
    print (build_dict)

    for key in build_dict:
        rs = (globals()[key](rs,build_dict[key]))
    print(rs)
    col3.dataframe(rs)

if __name__=="__main__":
    main()
Enjoy